Data from one home on a cold winter’s day in January shows how and why inefficient gas boilers end up costing residents more.
Guru Heat Smart allows property managers to monitor and remotely control individual gas boilers or heat pumps. It also captures ambient temperature and humidity data to help predict the risk of mould growth.
The Guru Heat Smart device captures detailed performance data from the heating system, including return temperatures from radiators.
Here we share time series data captured, and insight gained, from just one home.
Data shows that the heating system is working inefficiently

The above graph shows flow temperature (temperature of water travelling from the boiler to the radiators) and return temperature (the temperature of water travelling from the radiators back to the boiler).
The data shows us that return temperatures are almost as high as the flow temperatures, and in some cases there is no difference between the two. In practical terms this means that very hot water is rushing around the heating systems only imparting a small amount of useful heat to the dwelling via the radiators on each loop.
As a result of these high return temperatures, the condensing boiler cannot condense. In this situation the resident is likely to be paying up to 15% too much to achieve the same level of comfort in their home. This cost difference may be enough to push households into fuel poverty. It also means unnecessary carbon emissions.
Using Ofgem’s April 2022 price cap data, on average, paying 15% too much means an extra £155 for this resident on their gas bill per year. The price cap is expected to rise again by 78% in October, turning this £155 into £276.
Why high return temperatures cost residents more
High return temperatures mean boilers cannot work at maximum efficiency.
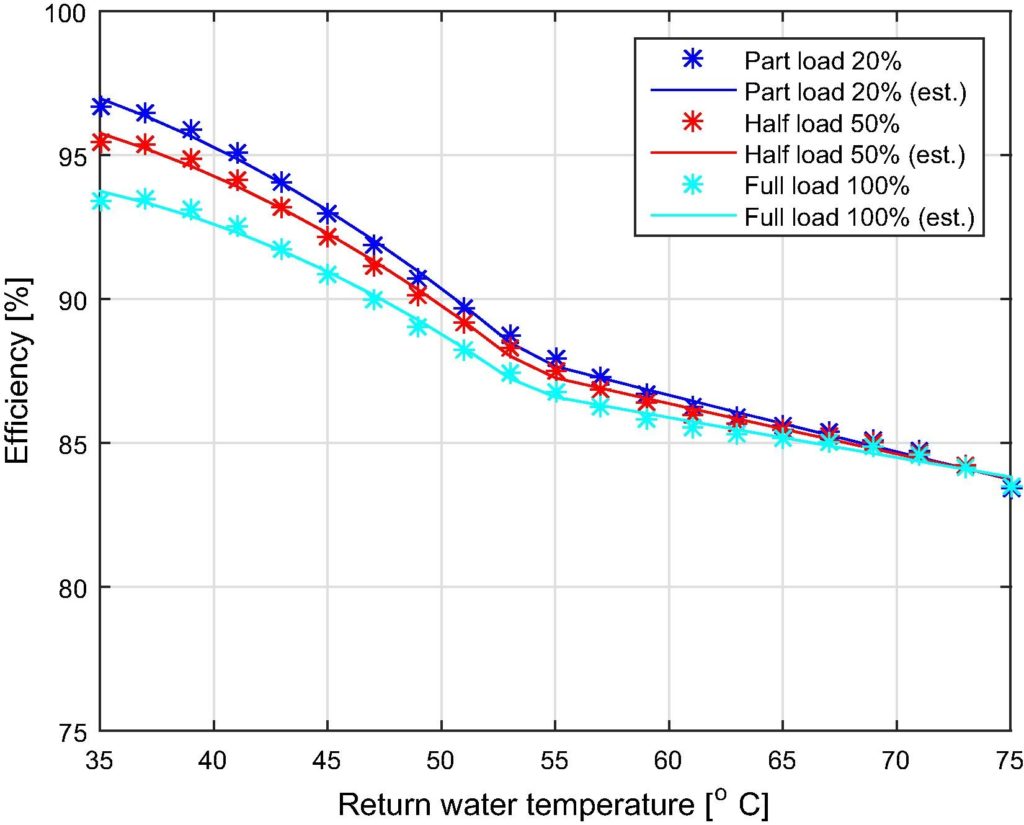
These two graphs show how efficient a domestic boiler can be at different return temperatures. The graph on the left shows a standard boiler, and the graph on the right shows an older boiler. The data we’re receiving shows return temperatures of up to 80°C and suggests that the boiler in this home is performing at something like 76% efficiency. Looking at the graph for the older boiler, the efficiency of a well performing but older condensing boiler should be more like 88%.
| Efficiency curve when the boiler is new | Efficiency curve when the boiler is degraded |
|---|---|
 |
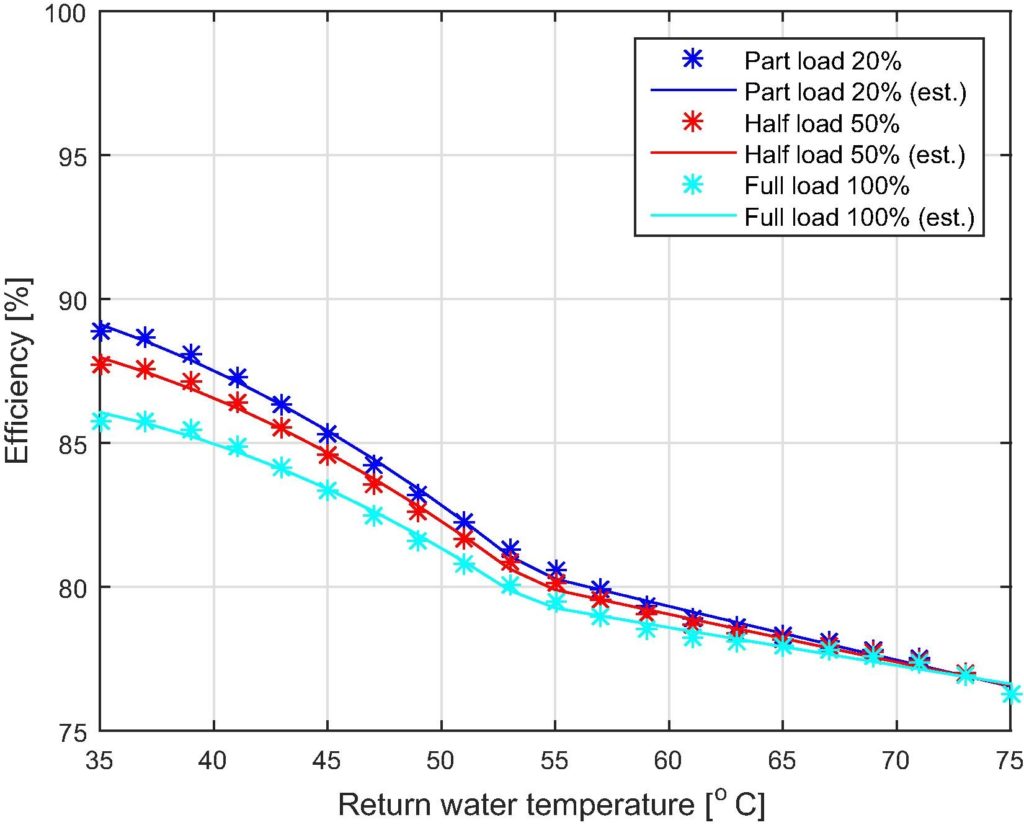 |
Source: Real-time monitoring energy efficiency and performance degradation of condensing boilers, by Simone Baldi et al. (2017)
The boiler cannot reach the temperature desired by the resident
The resident has their thermostat set to 30°C, but temperatures are only reaching 22°C inside the dwelling.
Setpoint temperature

Ambient temperature

This information is especially useful to a resident liaison team. If the heat system was fulfilling the resident’s apparent desire, this home would be being heated to 30°C three times per day. Data like this can help guide conversations around fuel bills.
Data used to indicate risk of condensation and mould growth
One the day in question, relative humidity within the home is, for the most part, low. Should this change, property managers could use this information to improve resident wellbeing with proactive maintenance, reducing property repair costs.
Relative humidity

The data being captured can be used to help understand how well a property is insulated
When heat load data is combined with ambient temperature data, and even outside temperature data, it’s possible to gather valuable information about the thermal characteristics of the dwelling – such as how well it’s insulated. This data can then be used to understand exactly how well a dwelling is performing in real life, instead of taking the EPC rating at face value.
The data being captured can be used help choose the correct heat pump in any future retrofit scenario
We can see that over the recent period of cold weather (including 1°C outdoor temperature) the home has had a peak heat load of 5 kW. This data can be used to help plan for any eventual replacement of gas boilers, including sizing heat pumps.
Central Heating Current Power (Instantaneous Demand)
")
Conclusion
Capturing detailed performance data from the heating system, including return temperatures from radiators, helps property to identify and resolve performance issues, and reduce maintenance callouts.
By viewing a resident’s heating settings remotely, Guru Heat Smart also helps property managers to spot issues like underheating, and so better support vulnerable customers.
Finally, where heat pumps have not yet been installed, performance data from the existing gas boiler and radiators can be used to correctly size the new system. Data-led insights into building characteristics can also help to guide future decisions around insulation.
To find out how monitoring and remotely control individual gas boilers or heat pumps could help your residents, please contact our Sales team via sales@gurusystems.com or 020 8050 4305