
Unmonitored heat networks don’t usually perform well; poorly performing networks mean higher costs and increased carbon emissions. Even where networks are well-designed and commissioned before residents move in, performance tends to drift over time. It is not uncommon for the cost of delivered heat to double in just a few years on unwatched networks.
Networks need to be monitored and managed to ensure good ongoing performance, going beyond just capturing consumption data. Guru Pinpoint displays real-time data from individual dwellings, block meters, and plant rooms to help diagnose problems and better understand your heat losses.
Upcoming regulation from Ofgem by 2025 will demand better performance from heat networks, with data reported annually. It’s more important than ever to ensure you are able to accurately capture data from your heat network, monitor it and report on it in order to be regulation compliant.
Spot problems early
A poorly performing network will lead to higher heat losses, higher costs for customers, and higher carbon emissions. Keeping on top of performance data minimises operating costs for your heat network. Guru Pinpoint displays heat network performance data in digestible charts and dashboards helping you to spot problems and identify trends.
When analysing your network data you will be able to explore in real-time to assess where the problem may be. Is it a handful of dwellings across the network that may not have been commissioned correctly? Or maybe there is just one block where a bypass has been left open?
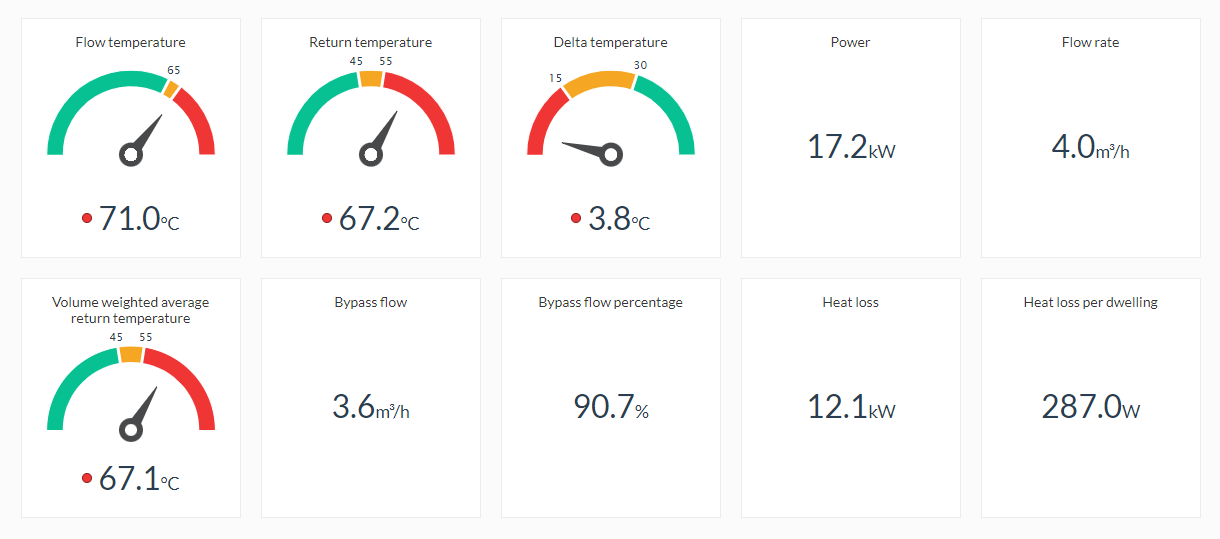
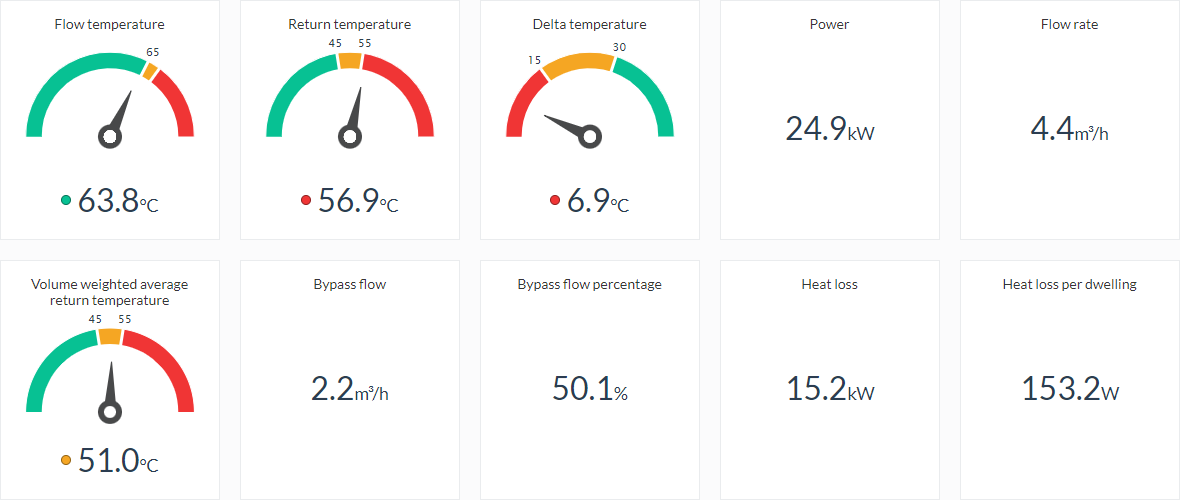
Below is the perfect example of a poorly performing heat network. Using Guru Pinpoint’s dashboard we are able to quickly see that something isn’t right using the traffic light system. Flow temperature, return temperature and Delta T are all coded in red, heat loss per dwelling is high, as are the bypass flow rates.
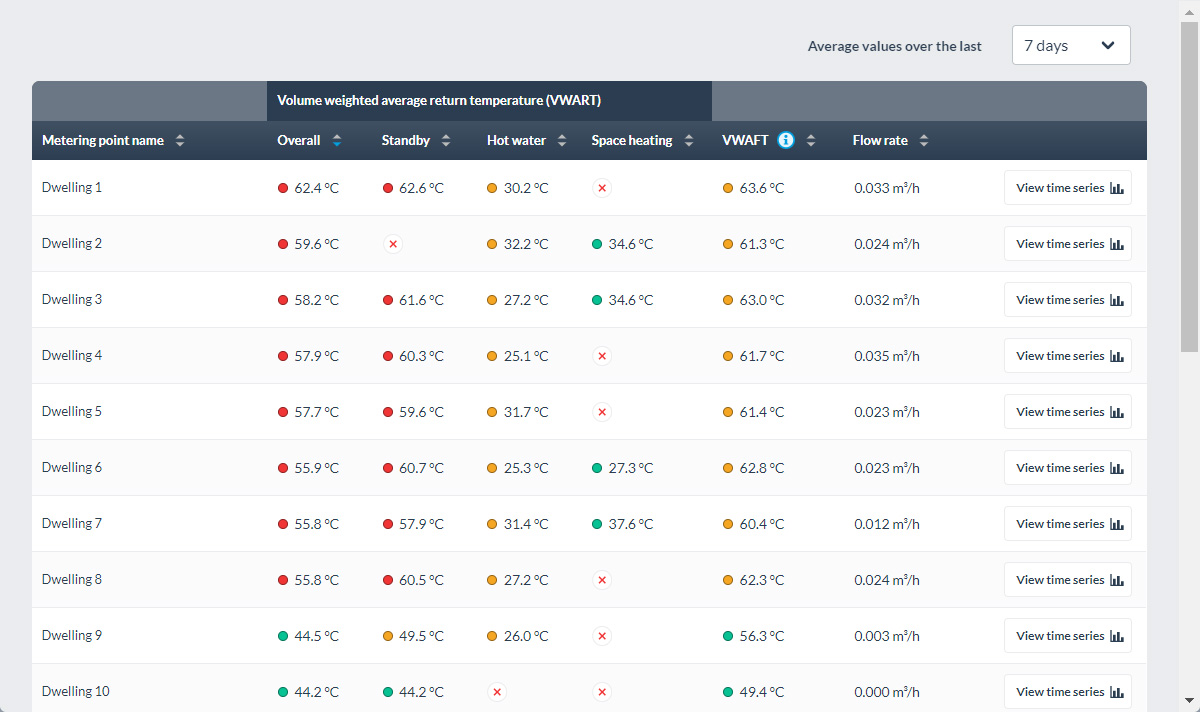
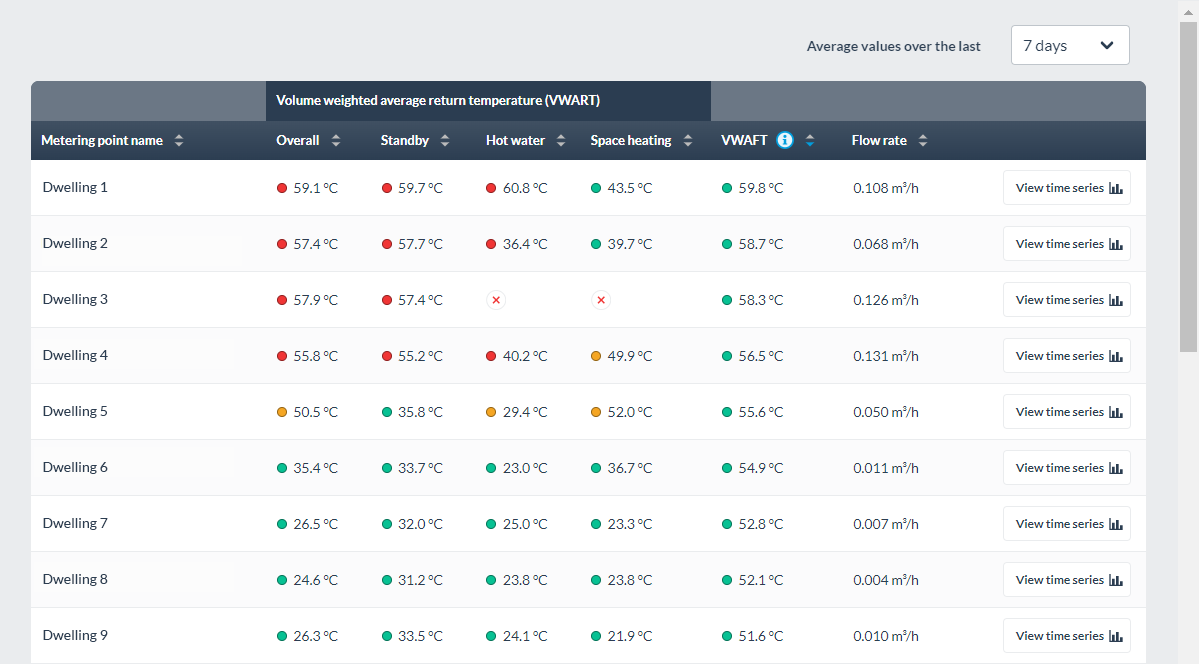
From here, we can view a list of dwellings on this network, ordering by Overall VWART to identify poorly performing dwellings before taking a closer look at time series data.
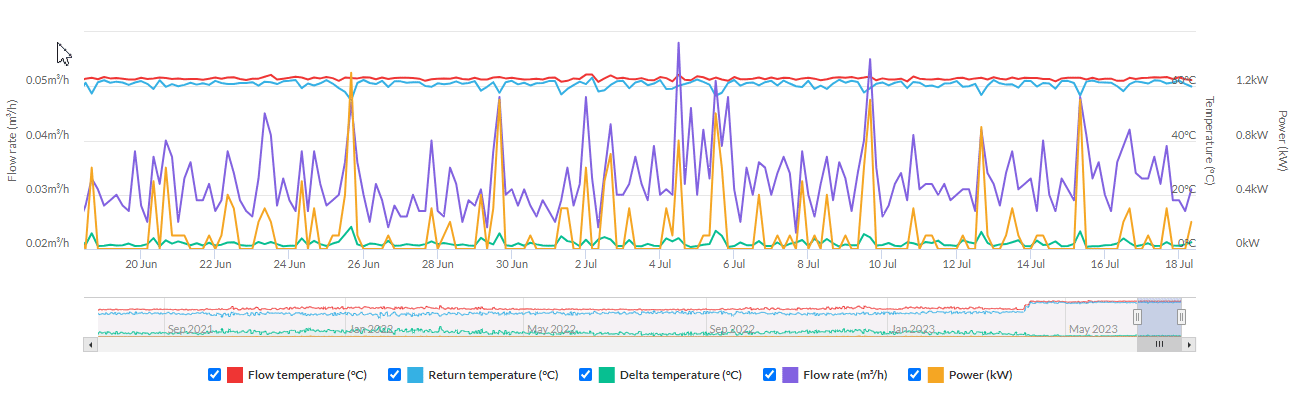
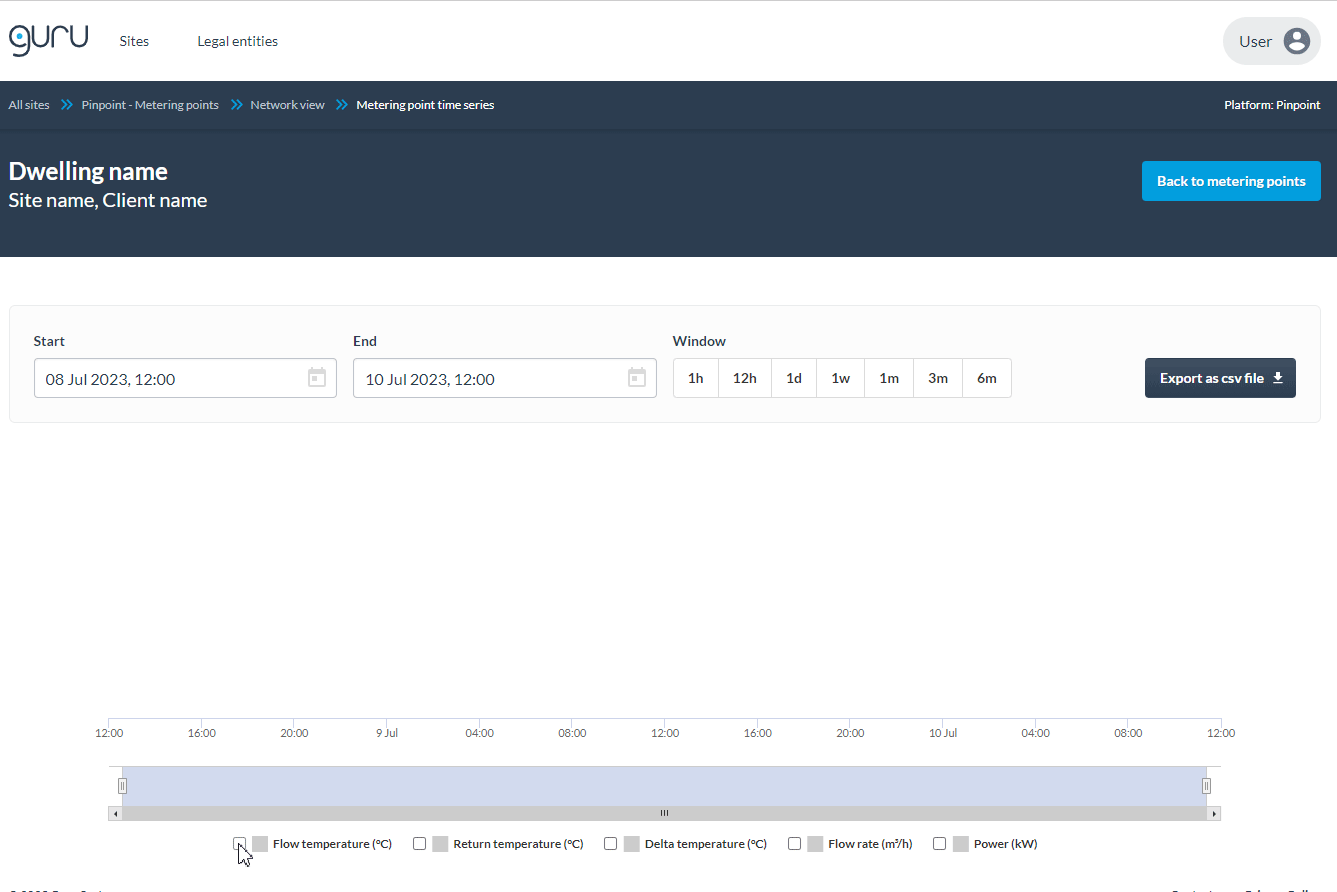
If we then look more closely at one of the dwellings on this network, we can see a similar pattern here too: Tightly coupled flow and return temperatures with a consistently high flow rate regardless of whether heat is being demanded or not. This tells us that interventions need to be made at the dwelling level, not just in the plant room.
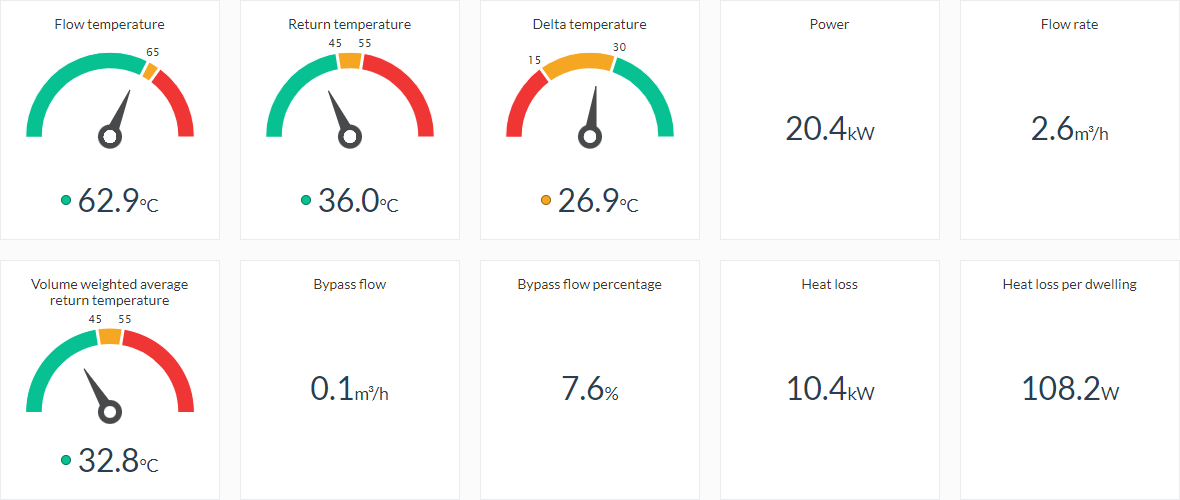
Next we have an example where dashboards can be used to help understand how different parts of the heat network are performing. The following two dashboards are from two different blocks on the same heat network – with data coming from the bulk meters from each block.
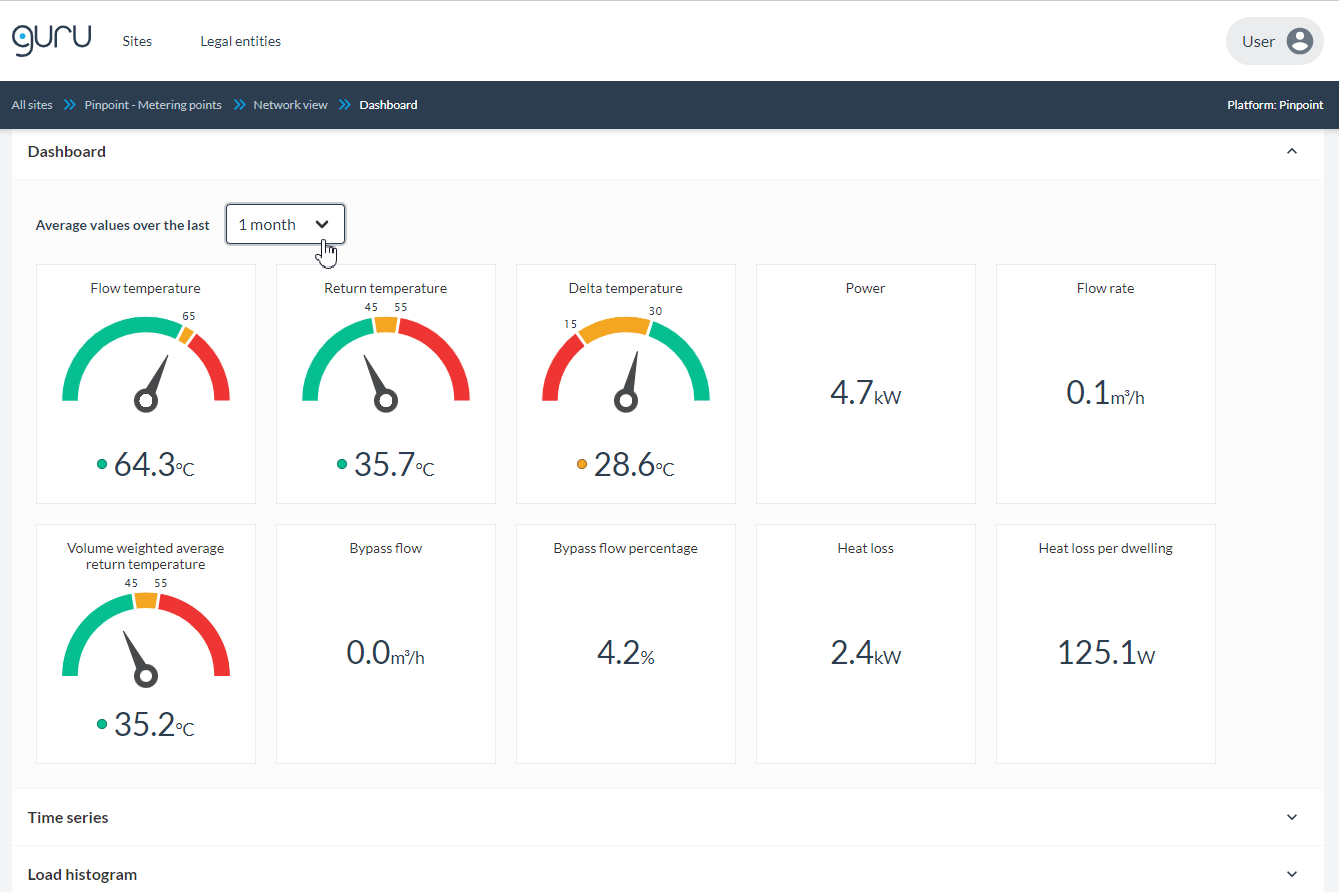
This block is performing well:
Whereas the adjacent block has a DeltaT of only 7 degrees and heat losses are about 50% higher than the first block. Here there appear to be one or more open bypasses on the block, with around half of the water pumped around the circuit coming back through a bypass rather than through an HIU. This is likely to be a commissioning issue.
By continuously monitoring your heat network performance, you can reduce call-outs, keep your operating costs low, and identify common heat network problems including HIU faults, open bypasses, and commissioning errors.
Read about Pinpoint in action

Case Study: Mildmay – HNES Demonstrator
Mildmay is a development-led network in Shoreditch, East London with 139 residential connections, a hospital, and a church, constructed in 2014 by Notting Hill Genesis. Guru Systems technology was installed at this site as part of the HNES Demonstrator programme in partnership with specialist engineering consultancy FairHeat and supported by housing association Notting Hill Genesis.
Visualise performance data, not just kWh
Ofgem will begin regulating heat networks by 2025. Changes will require all heat networks to report on their energy performance. Guru Pinpoint gives you the visibility to identify and fix problems so that your heat networks meet standards to avoid being flagged as non-compliant with regulation.
For network operators, it will be important that the data you’re submitting to Ofgem shows a well performing network. Submitting evidence of a poorly performing network is likely to mean the submission will be flagged up as a higher risk by Ofgem, potentially resulting in an audit and an imposed requirement for remediation. The best thing you can do is to collect data long before you have to submit it to Ofgem; that way, you have time to fix performance issues.
Our industry will need to make use of all heat network data to meet these requirements. Guru Pinpoint captures data across six registers: flow temperature (°C), return temperature (°C), flow rate (m3/hour), volume (m3), instantaneous power (kW), and energy (kWh). All six registers are needed to analyse heat network performance, it’s not enough to rely on infrequent kWh readings alone.
Guru Pinpoint displays this performance data and analyses all six registers – including using kWh data for heat loss calculations. Users can view real-time readings and enhanced data including delta temperature and heat losses across a network.
Understand volume weighted average return temperature
Guru Pinpoint also shows volume weighted average return temperature (VWART) by HIU mode. VWART is the best metric for understanding dwelling-level performance as it goes beyond showing the return temperature at a point in time and instead indicates how much water is being returned at that temperature.
Guru Pinpoint uses machine learning algorithms to determine which of the three modes an HIU is currently operating in (space heating, domestic hot water, or standby). It then calculates the volume weighted average return temperature for each mode – helping you to better diagnose problems and target maintenance visits or make remote changes.
For example, on the below heat network, the VWARTs by mode is clearly shown, which allows us to then sort the dwellings to identify that in this block it’s only five dwellings of the dwellings that are underperforming. This helps with the heat network operator target maintenance work.
Understanding where and why problems occur helps maintenance visits to go more smoothly on the day. Real-time data can be used to verify repairs or changes immediately to reduce the need for future call-outs.
View heat losses and heat loss per dwelling
Guru Pinpoint displays total heat losses and heat loss per dwelling for the entire network, and in zones downstream of any bulk meters. Dashboards and colour-coded network maps help to identify where heat losses are, supporting targeted interventions. Heat network performance has the biggest influence on resident heating bills and so accurately monitoring your heat network is of great significance in reducing customer bills.
For Ogem, as well as reporting, new and existing sites will also have to meet minimum technical standards including regulations protecting customers. Average heat loss data is available over 1 day, 7 days, 1 month, 3 months or 6 months, helping you to prepare for existing and future reporting requirements. Use data displayed on Guru Pinpoint to verify that regulatory and site-specific requirements are being met, both ahead of handover and in operation.
Better performance means reduced costs
If we consider the big picture of heat network management ultimately we continue to return to one simple fact; better performance means reduced costs for both the operator and the customer. Capturing and monitoring your heat network data is not just about reporting requirements but is also about making real changes that improve the efficiency of your heat network.
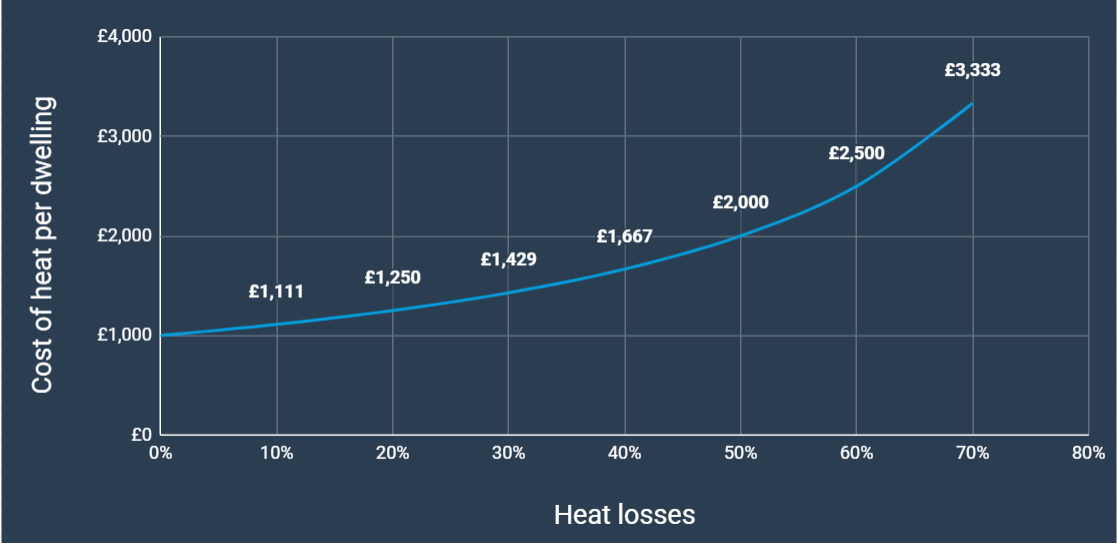
Inefficiency on a heat network acts as a multiplier of the underlying input fuel cost, whether that is gas, electricity or other sources. In short, inefficient networks use more fuel to deliver the same amount of useful heat to customers, and so they cost more to run – and those costs are usually passed on to residents.
For example:
- On a well-performing heat network, if 20% of the heat supplied to a heat network is lost from the network as heat losses, then 80% of the heat energy leaving the plant room is ‘useful’. The cost per unit of heat at the point of generation is divided by 0.8 (or multiplied by 1.25) to arrive at the cost per unit of heat consumed by customers on the network.
- On a poorly performing network, if 70% of the heat supplied to a heat network is lost from the network as heat losses, then 30% of the heat energy leaving the plant room is ‘useful’. The cost per unit of heat at the point of generation is divided by 0.3 (or multiplied by 3.33) to arrive at the cost per unit of heat consumed by customers on the network.
While many heat networks do run well, especially those that are monitored using performance data, many do not perform anywhere near their intended efficiency. Work carried out by Guru Systems for DESNZ found that on average many only deliver 36% of input energy to dwellings as useful heat, against design efficiencies of more than 80%.
Data visibility drives good performance
As we have discussed throughout, even where networks are well-designed and properly commissioned before residents move in, heat networks are often left to drift, with performance degrading over time.
This is often not due to a fault in equipment but rather is due to the accumulation of many small changes in the system over time, for example, maintenance engineers changing one part of a heat network without regard to the effect on the whole.
Access to detailed data for site-wide diagnostics allows problems or inefficiencies to be identified, reducing total energy costs. It can also point maintenance engineers in the right direction, reducing the time spent investigating problems on-site.
Use Guru Pinpoint to monitor, analyse and report on your heat network data and begin to improve the efficiency and performance of your heat network to reduce costs, meet regulatory requirements and reduce carbon emissions through better management.
Want to know more about Guru Pinpoint? Speak to our Sales team via sales@gurusystems.com or 020 8050 4305 or fill in the below form to make an enquiry.