The Heat Network Efficiency Scheme (HNES) is awarding £32m worth of grant funding across eight rounds to heat network operators who want to improve the performance of their existing heat networks.
>> Read more about the details of the scheme in our post How to use Heat Network Efficiency Scheme funding to improve your existing heat networks.
Guru Systems supported six projects as part of the previous HNES Demonstrator. Here’s why capturing performance data every five minutes before, during, and after your HNES project makes for a more successful project.
Guru Systems technology is covered by HNES funding
Capital funding will cover interventions in any of the following four areas: energy centres/plant rooms, primary/secondary distribution networks, tertiary networks, and metering.
HNES funding can cover the installation of meters and metering equipment if it improves operator knowledge of network performance or enables reporting of project performance. This means that Guru Systems’ hardware can be funded.
Guru Hub 2 and Guru Hub 3 Core are part of what the guidance refers to as a smart solution. This provides an interface to metering and the ability to make use of energy performance data.
It’s important to note that if the heat supplier is required to install heat meters under the Heat Network (Metering and Billing) Regulations (i.e. a cost-effectiveness assessment shows it is economically viable to fit heat meters in line with the regulations), then funding from HNES for heat meters themselves will not be covered – however as Guru Systems hardware is part of a smart solution, HNES funding can still cover this equipment.
The scheme guidance details exactly what is and isn’t covered within these categories.
Use Guru Pinpoint to spot problem areas on your network
One of the important differences between the Demonstrator and the main Scheme, open to applications on Monday 6th February, is the performance reporting requirements.
Successful HNES projects are subject to a variety of minimum reporting requirements – including reporting performance-related KPIs for 24 months after all funding measures have been installed and commissioned.
Guru Systems can provide data to support these performance reporting requirements. Guru Hub 2 also captures heat network performance data every five minutes for analysis via our online analytics platform Guru Pinpoint. Guru Pinpoint uses machine learning algorithms to help you identify and resolve performance issues and improve the efficiency of your heat network.
Use our Guru Verify dashboard to check interventions have been delivered as planned
Regardless of which type of interventions are expected to be covered, Guru Systems always argues that interventions should be data-led, and that performance data should also be used to check that those interventions have been delivered correctly.
While interventions may be meticulously planned, it’s important that any HNES-funded projects can hold their contractors to account and ensure that every single dwelling is performing as expected, with outcomes verified.
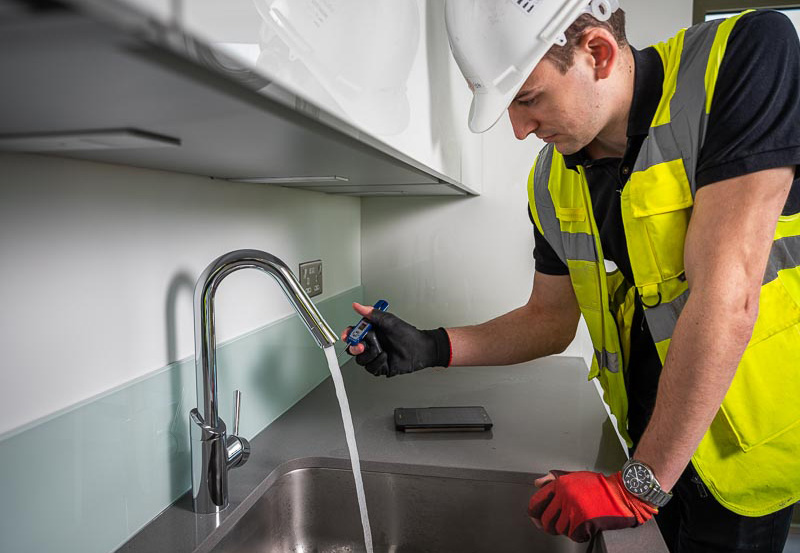
Guru Verify is our mobile and web app for quicker, more cost effective acceptance testing. It gives you the ability to test dwellings using the mobile app and track progress across the entire site using the web platform. Find out more in the video:
Manage ongoing performance to ensure payback on the project
A poorly performing network will lead to higher heat losses, higher costs for customers and higher carbon emissions. Keeping on top of performance data means minimised operating costs over the HNES reporting period and beyond, ensuring payback on the project.
The below chart shows a dwelling on one of the sites Guru Systems technology was installed at as part of the HNES demonstrator. Before the intervention, flow rate was very high (45 litres every hour) and flow and return temperatures were high, and tightly coupled.
Before:

After:

After the intervention, we see much better performance as shown in the graph above. When the HIU is in standby mode (power at 0 kW) flow temperature (dark blue) and return temperature (green) is low, but when heat is demanded, flow temperature jumps to around 65°C and return temperature drops right down to near 20°C showing that lots of heat energy has been extracted, and cool water is flowing back to the plant room. This is exactly what you want to see both over the HNES reporting period and beyond.
We will be holding a webinar, ‘Sharing best practice from the Heat Network Efficiency Scheme Demonstrator’, on Friday 24th February 11am-12pm which you are able to sign-up for here.

